src/test/balance-rotate.c
Rotation of a circular interface - MPI Load Balancing test
This test is a modified version of rotate.c. The goal is to test the correct split of load between processors, given a user assigned scalar field ‘weights’, a representative of the computational load being carried out in a specific cell.
There are two versions of this test: balance-rotate.c where the weights are given by the user and balance-rotate-auto.c which uses the LB_AUTO compilation flag to automatically measure the load of each process.
We advect a circular interface along a circular path. To simulate an imbalance in the load between cells, we add an intensive calculation only in the region marked by the ‘c’ field.
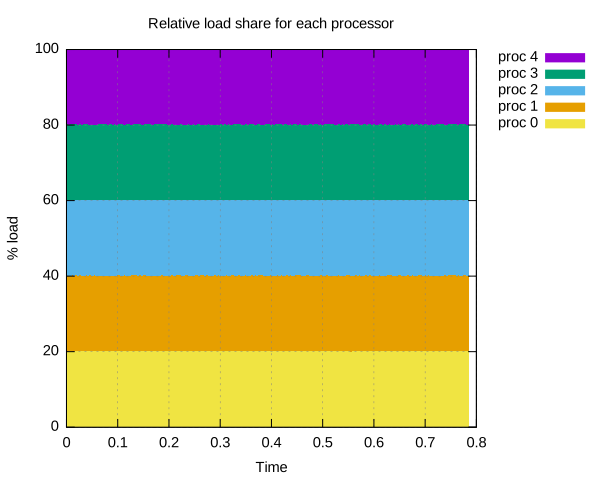
The total load is defined as the sum of the individual weights of each cell. Ideally, each processor gets total_load/n_proc amount of work. This is also the configuration that minimizes the idle time between processors waiting for the other to finish their computations.
#include "advection.h"
#include "vof.h"
Diagnostic functions needed for interesting statistics. ‘balance_score’ computes the number of cells and the load assigned to each processor. ‘parallel_efficency’ gives a quantitative measure of the imbalance.
void balance_score (long* counter, double* load, (const) scalar w) {
  for (int ne = 0; ne < npe(); ne++) {
    counter[ne] = 0;
    load[ne] = 0.;
  }

  foreach() {
    counter[pid()] += 1;
    load[pid()] += w[];
  }

  if (pid() == 0) {
    MPI_Reduce(MPI_IN_PLACE, counter, npe(), MPI_LONG, MPI_SUM, 0, MPI_COMM_WORLD);
    MPI_Reduce(MPI_IN_PLACE, load, npe(), MPI_DOUBLE, MPI_SUM, 0, MPI_COMM_WORLD);
  } else {
    MPI_Reduce(counter, NULL, npe(), MPI_LONG, MPI_SUM, 0, MPI_COMM_WORLD);
    MPI_Reduce(load, NULL, npe(), MPI_DOUBLE, MPI_SUM, 0, MPI_COMM_WORLD);
  }
}

double parallel_efficency (double* load) {
  //compute parallel efficency given the load array
  double tot_load = 0., max_load = -1;
  for (int ne = 0; ne < npe(); ne++) {
    tot_load += load[ne];
    if (load[ne] > max_load)
      max_load = load[ne];
  }
  return max_load ? (tot_load/npe())/max_load : 1.;
}
‘measured_efficiency’ returns the parallel efficiency (mean/max) of a per-rank scalar measurement ‘busy’ (the wall-clock time spent in the heavy region). Unlike the weight-based score it needs no user cost model: it reports the real measured cost.
double measured_efficiency (double busy) {
  double busy_sum = busy, busy_max = busy;
  mpi_all_reduce (busy_sum, MPI_DOUBLE, MPI_SUM);
  mpi_all_reduce (busy_max, MPI_DOUBLE, MPI_MAX);
  return (busy_sum/npe())/busy_max;
}

scalar c[];
scalar * interfaces = {c}, * tracers = NULL;
int MAXLEVEL = 8;

int main() {
  origin (-0.5, -0.5);
  init_grid (1 << MAXLEVEL);
  run ();
}

#define circle(x,y) (sq(0.1) - (sq(x-0.25) + sq(y)))

event init (i = 0) {
  fraction (c, circle(x,y));
#if !LB_AUTO
  balance_weights = new scalar;
#endif
}

#define end 0.785398

event velocity (i++) {
#if !LB_AUTO
  foreach()
    balance_weights[] = (c[] > 1e-10) ? 200. : 1.;
#endif

#if TREE
  double cmax = 1e-3;
  adapt_wavelet ({c}, &cmax, MAXLEVEL);
#endif

  double a = -8.;
  trash ({u});
  foreach_face(x) u.x[] = - a*y;
  foreach_face(y) u.y[] =   a*x;
}

event logfile (i++) {
  long ncells[npe()]; double load[npe()];
  balance_score (ncells, load, balance_weights);

  if (pid() == 0 && i > 1) {
    double ef = parallel_efficency (load);
#if LB_AUTO
    if (i > 10) // skip the initalization effect on the balancing
      assert (ef > 0.9);
#endif
    fprintf (stderr, "%g %g ", t, ef);
    for (int ne = 0; ne < npe(); ne++) fprintf (stderr, "%ld ", ncells[ne]);
    for (int ne = 0; ne < npe(); ne++) fprintf (stderr, "%g ", load[ne]);
    fprintf (stderr, "\n");
  }
}
We simulate a hefty computational cost in the cell with a non-zero volume fraction.
event slowdown (i++) {
  timer ts = timer_start();
  foreach()
    if (c[] > 1e-10) {
      double s = 0.;
      for (int k = 0; k < 10000; k++)
        s += sin (k * 1.000001) * cos (k * 0.999999);
      // force the result to be observed so -O2 can't drop the loop
      if (s == HUGE) fprintf (stderr, "unreachable %g\n", s);
    }
  // foreach() over local cells does no MPI, so this is pure on-rank busy
  // time: an independent, weight-free measure of the real load imbalance.
  double busy = timer_elapsed (ts);

  double eff = measured_efficiency (busy);   // collective: all ranks
  if (pid() == 0 && i > 1) {
#if LB_AUTO
    if (i > 10) // skip the initalization effect on the balancing
      assert (eff > 0.5);
#endif
    static FILE * fp = fopen ("perf", "w");
    fprintf (fp, "%g %g\n", t, eff);
    fflush (fp);
  }
}

#if TRACE > 1
event profiling (i += 20) {
  static FILE * fp = fopen ("profiling", "w");
  trace_print (fp, 1);
}
#endif

event stop (t = end);
Results
set xlabel "Time"
set ylabel "Weighted Parallel efficiency"

set yrange [0:1]

plot "log" u 1:2 w l lw 3 lc "red" notitle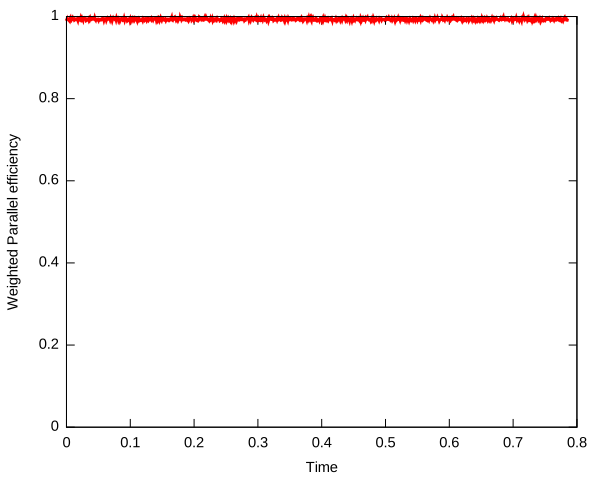
set xlabel "Time"
set ylabel "Measured parallel efficiency"

set yrange [0:1]

# weight-free: mean/max of the per-rank wall-clock time spent in the heavy
# region (event slowdown), independent of the balance_weights cost model.
plot "perf" u 1:2 w l lw 3 lc "blue" notitle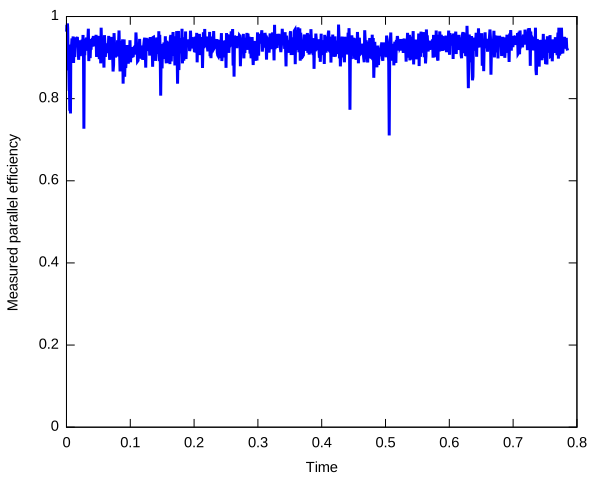
set title "Relative cell share for each processor"
set xlabel "Time"
set ylabel "% cells"
set yrange [0:100]
set key outside
set grid front

# 5 processes (-D_MPI=5): ncells in columns 3..7.
# Draw the cumulative sum 3..i normalised by the total (3..7), largest
# first, filled to the x-axis: each smaller fill is painted on top,
# leaving one stacked band per proc that sums to 100%.
plot for [i=7:3:-1] "log" u 1:(100.*(sum [c=3:i] column(c))/(sum [c=3:7] column(c))) \
     w filledcurves x1 title sprintf("proc %d", i-3)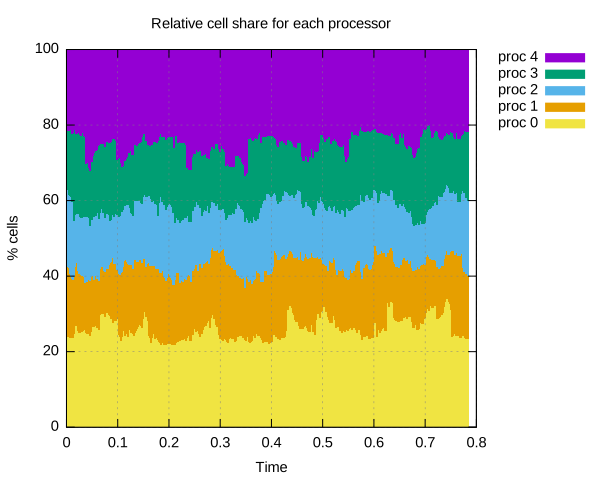
set title "Relative load share for each processor"
set xlabel "Time"
set ylabel "% load"
set yrange [0:100]
set key outside
set grid front

# 5 processes (-D_MPI=5): load values in columns 8..12.
plot for [i=12:8:-1] "log" u 1:(100.*(sum [c=8:i] column(c))/(sum [c=8:12] column(c))) \
     w filledcurves x1 title sprintf("proc %d", i-8)