sandbox/msaini/Marangoni/marangoni.c
#include "axi.h"
#include "navier-stokes/centered.h"

#if CLSVOF
# include "two-phase-clsvof.h"
# include "integral.h"
#elif HF2D
# include "two-phase-HF.h"
#include "integral.h"
#elif PALAS
#include "two-phase.h"
#include "../../farsoiya/marangoni_surfactant/marangoni.h"
#else
#include "two-phase.h"
#include "integral-HF.h"
#endif
#include "view.h"

int LEVEL = 8;

const double R = 1. [1], NablaT = 1., Mu = 1., Rho = 1. [0];
const double Re = 0.066, Ca = 0.66;
const double Gamma_T = Re*sq(Mu)/(Rho*sq(R)*NablaT);
const double Gamma_0 = (Gamma_T*R*NablaT)/Ca;
const double t0 = Mu/(Gamma_T*NablaT);
const double Cdrop = 1., Cbulk = 1.;
double U_drop;
#if !PALAS
scalar sigmaf[];
#endif
FILE *fp;
int main()
{
  size (16*R);
  origin (- L0/2.);
  rho1 = rho2 = Rho;
  mu1 = mu2 = Mu;
#if !PALAS
#if CLSVOF || HF2D
  d.sigmaf = sigmaf;
#else
  f.sigmaf = sigmaf;
#endif
#endif
  TOLERANCE = 1e-4 [*];

  U_drop = - 2./((2. + 3.*mu2/mu1)*(2. + Cdrop/Cbulk))*Gamma_T*R*NablaT/mu1;

  for (LEVEL = 7; LEVEL <= 9; LEVEL++) {
    N = 1 << LEVEL;
    run();
  }
}
We initialize the signed distance d and the surface tension gradient.
event init (t = 0)
{
  char filename[80];
  sprintf(filename,"out%d",LEVEL);
  fp = fopen(filename,"w");
  vertex scalar dist[];
  foreach_vertex()
    dist[] = sqrt (sq(x) + sq(y)) - R;

#if CLSVOF || HF2D
  foreach() {
    d[] = sqrt (sq(x) + sq(y)) - R;
  }
#else
  fractions(dist,f);
#endif
  foreach()
    sigmaf[] = Gamma_0 + Gamma_T*NablaT*x;
}
We log the position of the center of mass of the bubble, its velocity and volume as well as convergence statistics for the multigrid solvers.
double u_drop = 0.;

event logfile (i += 5)
{
  double xb = 0., vb = 0., sb = 0.;
  static double xb0 = 0., previous = 0.;
  if (t == 0.)
    previous = 0.;
  foreach(reduction(+:xb) reduction(+:vb) reduction(+:sb)) {
    double dv = (1. - f[])*dv();
    vb += u.x[]*dv;
    xb += x*dv;
    sb += dv;
  }
  static double sb0 = 0.;
  if (i == 0) {
    sb0 = sb;
    fprintf (fp, "#t dsb xb vb/U_drop ta u_drop/U_drop dt perf.t perf.speed\n");
  }
  u_drop = t > previous ? (xb/sb - xb0)/(t - previous) : 0.;
  fprintf (fp, "%g %g %g %g %g %g %g %g %g \n",
	   t/t0, (sb - sb0)/sb0, xb/sb, vb/sb/U_drop,
	   (t + previous)/2./t0, u_drop/U_drop,
	   dt, perf.t, perf.speed);
  xb0 = xb/sb, previous = t;
  fflush (fp);
}

event end (t = 3.*t0)
{
  fprintf(ferr,"%d %g\n",LEVEL,1. - u_drop/U_drop);
  if (LEVEL == 8) {
    view (fov = 30, near = 0.01, far = 1000,
	  tx = 0.009, ty = -0.076, tz = -0.291,
	  width = 1239, height = 575);
    draw_vof (c = "f", filled = - 1, fc = {1,1,1});
    draw_vof (c = "f", lw = 2);
    squares (color = "sigmaf", spread = 0.8, linear = true);
    vectors (u = "u", scale = 1);
    cells ();
    save ("fields.png");
  }
}
#if TREE
event adapt (i++) {
  adapt_wavelet ({f,u}, (double[]){1e-2, 1e-5, 1e-5}, LEVEL);
}
#endif
Final velocity field, interface, surface tension gradient and adaptive mesh for
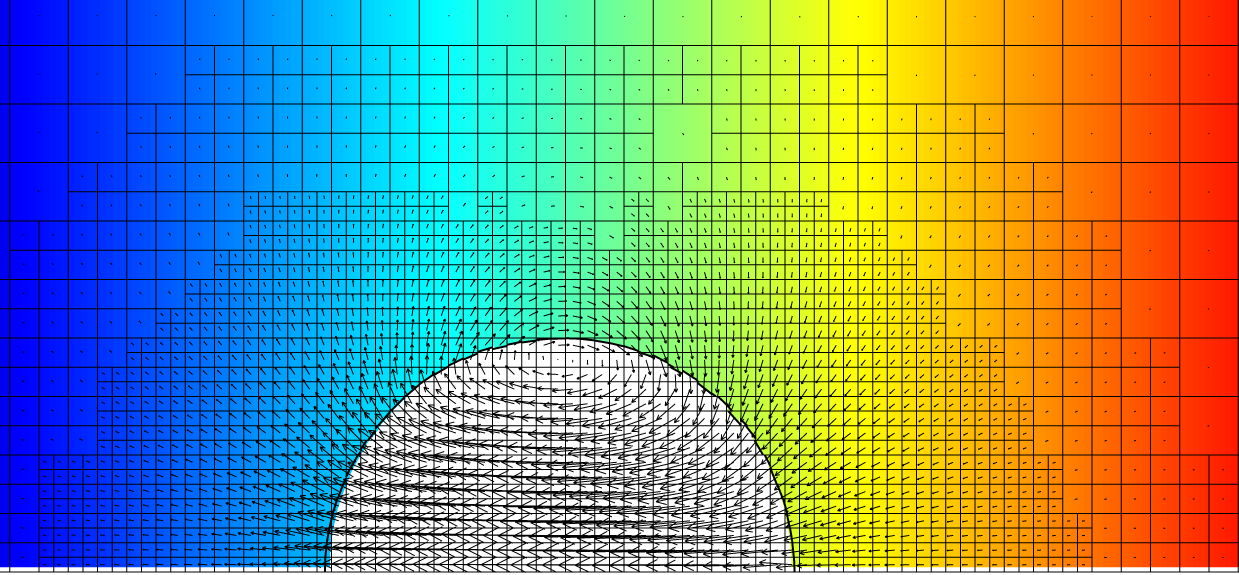
the HF method

the HF2D method
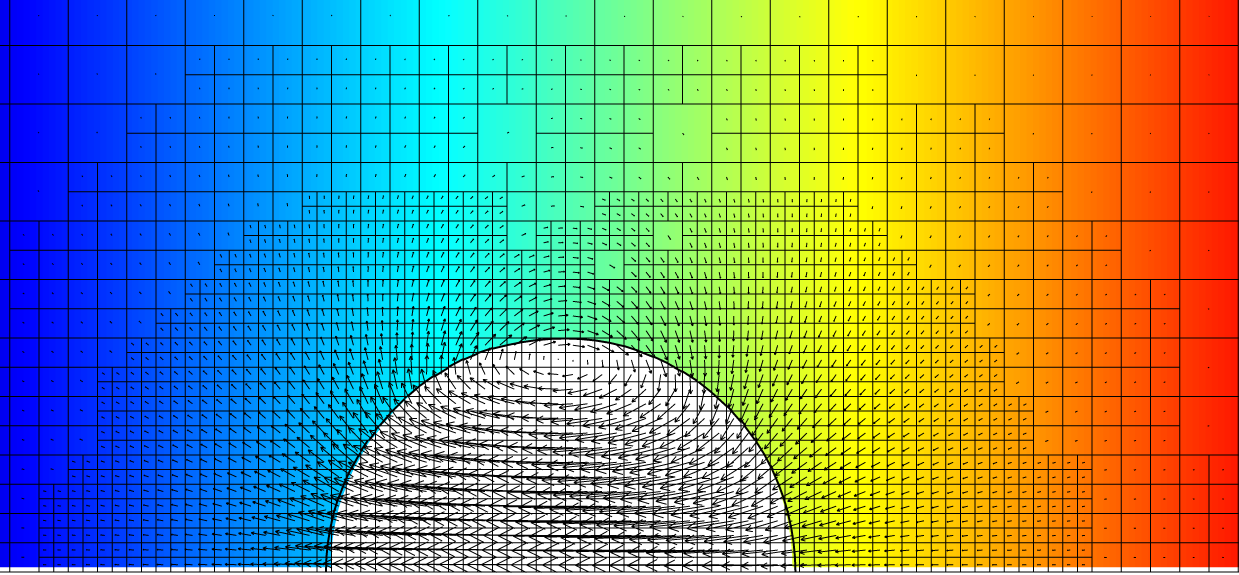
the CLSVOF method

Palas’s method
import numpy
import sys
import string
import math
import glob
from pylab import *
from matplotlib.colors import LogNorm, Normalize,ListedColormap
from scipy.interpolate import CubicSpline
from matplotlib.ticker import LogLocator

params = {
    'axes.labelsize': 14,
    'font.size': 12,
    'mathtext.fontset' : 'cm',
    'font.family' : 'sans-serif',
    'legend.fontsize': 12,
    'xtick.labelsize': 12,
    'ytick.labelsize': 12,
    'xtick.major.size' : 2.,
    'ytick.major.size' : 2.,
    'xtick.minor.size' : 1.,
    'ytick.minor.size' : 1.,
    'text.usetex': False,
#    'figure.figsize': [2.15,1.85],
    'axes.linewidth' : 0.75,
    'figure.subplot.left' : 0.1,
    'figure.subplot.bottom' : 0.18,
    'figure.subplot.right' : 0.96,
    'figure.subplot.top' : 0.98,
    'savefig.dpi' : 300,
}
rcParams.update(params)

datafile1 = "./out9"
data1=numpy.loadtxt(datafile1)

datafile2 = "../marangoni-hf2d/out9"
data2=numpy.loadtxt(datafile2)

datafile3 = "../marangoni-clsvof/out9"
data3=numpy.loadtxt(datafile3)

datafile4 = "../marangoni-PF/out9"
data4=numpy.loadtxt(datafile4)

xdata=np.linspace(0,3,100)

fig, ax = plt.subplots(1, 2, figsize=(6.29921, 2.5), gridspec_kw={'wspace': 0.4})

ax[0].set_ylabel(r'$u/u_{YGB}$',labelpad=1)
ax[0].set_xlabel(r'$t/t_c$',labelpad=1)

ax[0].set_yticks([0.9,0.92,0.94,0.96,0.98,1.,1.02])
ax[0].set_xticks([0.0,1.,2.,3.])

ax[0].set_xlim(-0.02,3)
ax[0].set_ylim(0.9,1.02)

ax[0].plot(data3[::,0],data3[::,5],'--',linewidth=1.,color='#ce2d4f',label="CLSVOF",dashes=(4,2))
ax[0].plot(data1[::,0],data1[::,5],'--',linewidth=1.,color='#5aae61',label="HF",dashes=(4,1.5))
ax[0].plot(data2[::,0],data2[::,5],'--',linewidth=1.,color='#0000FF',label="HF2D",dashes=(4,3))
ax[0].plot(data4[::,0],data4[::,5],'--',linewidth=1.,color='#FF00FF',label=r"Farsoiya et al.",dashes=(4,3))
ax[0].plot(xdata,[1.]*100,'--',linewidth=1.5,color='#000000',label="Analytical")

ax[0].legend(ncol = 1, loc=4,frameon=False,fontsize=10)
NUM=200
x = np.logspace(0,2,num=NUM)
levels=np.array([7,8,9])
folders=[".","../marangoni-hf2d","../marangoni-clsvof","../marangoni-PF"]

error=np.zeros(12)

count=0
for i in folders:
    for j in levels:
        datafile = "%s/out%d" % (i,j)
        print(datafile)
        data=numpy.loadtxt(datafile)
        ind=np.where(data[::,0] > 2.5)
        ydata=data[::,3][ind]
        tdata=data[::,0][ind]
        sum=0
        tsum=0
        for nn in range(len(ydata)-1):
            dt=tdata[nn+1] - tdata[nn]
            vavg=(ydata[nn+1] + ydata[nn])/2.
            sum+=(1. - vavg)**2.*dt**2.
            tsum+=dt**2.
        error[count]=(sum/tsum)**0.5
        count += 1

#print(error,error[3:6])

npr=np.array([8,16,32])
ax[1].plot(npr,error[6:9],'o-',linewidth=2,color='#ce2d4f',label="CLSVOF")
ax[1].plot(npr,error[:3],'o-',linewidth=2,color='#5aae61',label="HF")
ax[1].plot(npr,error[3:6],'o-',linewidth=2,color='#0000FF',label="HF2D")
ax[1].plot(npr,error[9:12],'o-',linewidth=2,color='#FF00FF',label="Farsoiya et al.")

ax[1].set_xscale("log", base=2)
ax[1].set_yscale("log")

ax[1].xaxis.set_major_locator(LogLocator(base=2.0, numticks=10))

ax[1].set_xlim(4,42)
ax[1].set_ylim(0.0001,0.2)

ax[1].plot(x,10/x/x/5,'-',linewidth=2,color = "#000000",label="Order 2")

ax[1].legend(ncol = 1, loc=0,frameon=False,fontsize=10)

ax[1].set_ylabel(r'$\epsilon_{L2}(u)$',labelpad=1)
ax[1].set_xlabel(r'$N/R$',labelpad=1)

fig.text(0.0, 0.98, '$(b)$', fontsize=14, fontweight='bold')
fig.text(0.48, 0.98, '$(c)$', fontsize=14, fontweight='bold')

savefig('velMarangoni.svg', bbox_inches='tight', pad_inches=0.3/2.54)
Velocity and convergence (script)